Radial velocity confirmation of K2-100b:
A young, highly irradiated, and low density transiting hot Neptune
Oscar Barragán, S. Aigrain, D. Kubyshkina, D. Gandolfi, J. Livingston, M. C. V. Fridlund, L. Fossati, J. Korth,
H. Parviainen, L. Malavolta, E. Palle, H. J. Deeg, G. Nowak, V. Rajpaul, N. Zicher, G. Antoniciello, N. Narita, et al.
MNRAS, 2019, 490, 698 (arXiv:1909.05252)

Abstract
We present a detailed analysis of HARPS-N radial velocity (RV) observations of K2-100, a young and active star in the Praesepe cluster, which hosts a transiting planet with a period of 1.7 days. We model the activity-induced radial velocity variations of the host star with a Gaussian Process framework and detect a planetary signal of 10.6 +/- 3.0 m/s which matches the transit ephemeris , and translates to a planet mass of 21.8 +/- 6.2 Earth Masses. This is the first mass measurement for a transiting planet in a young open cluster . The relative low density of the planet, 2.04 +/- 0.66 g/cm³, implies that K2-100b retains a significant volatile envelope. We estimate that the planet is losing its atmosphere at a rate of 10¹¹-10¹² g s⁻¹ due to the high level of radiation it receives from its host star.
The planet: K2-100b
K2-100b is a transiting planet orbiting (period of 1.67d) a young (750 Myr) Praesepe star discovered by the K2 mission (Mann et al., 2017). Space and ground-base photometric follow-up confirmed the planetary nature of the transit signal (see Figure 1 to see transit data from the K2 mission). Behold, a transiting planet orbiting a relatively bright (V=10.52 mag) Praesepe star. The RV follow-up was imminent.
Figure 1: Top: K2-100b transits. Left and Right panels correspond to K2 Campaign 5 and 18 data, respectively, folded to the orbital period of K2-100b. Bottom: Ilustration of K2-100b transiting its host star.
Radial velocities and stellar activity
We got 78 RV measurements with HARPS-N to measure the planet mass. But, K2-100 is a young star, it is magnetically active, it has active regions on its surface.
Active regions on stellar surfaces give rise to quasi-periodic variations in the apparent stellar RV . They can be very difficult to disentangle from the planetary signal, specially for young and fast-rotating stars. Fortunately, the activity/symmetry indicators give us hits about the stellar surface, we can then use them to correct the RVs for activity induced signals. Figure 2 shows an example of how surface features correlate with RV and activity/symmetry indicators for the Sun.
Figure 2: The animation shows the solar data (RV and activity/symmetry indicators) collected by Collier-Cameron et al. (2019, right panel) synchronised with images of the Sun's surface taken by the Solar Dynamics Observatory (left panel). RV data are shown once all solar system planets influcence has been remove.
Multi-dimensional Gaussian Process
Rajpaul et al. (2015) created a novel and powerful approach to disentangle planetary and activity signals with a multi-dimensional Gaussian-Process (GP) approach. Long story short, when modelled simultaneously, activity/symmetry indicators guide the GP to track only the activity, making it possible to recover the planet signal.
All mathematical complexity of this method is described in Rajpaul et al. (2015). Figure 3 shows a qualitative example of the approach, the activity indicator (in this case log R'_HK) and RV correlate in such a way that the big changes in RV happen with the big changes of the activity indicator.
Figure 3: RV (top) and activity indicator (in this case logR'_HK, bottom) timeseries. Models are sinchronized to show how the changes in the activity indicator helps to model the RV timeseries.
Results
We coded the multi-dimensional GP approach into pyaneti (Barragán et al., 2019) and we recover a RV semi-amplitude of
10.6±3.0ms−1
21.8 ± 6.2 M⊕
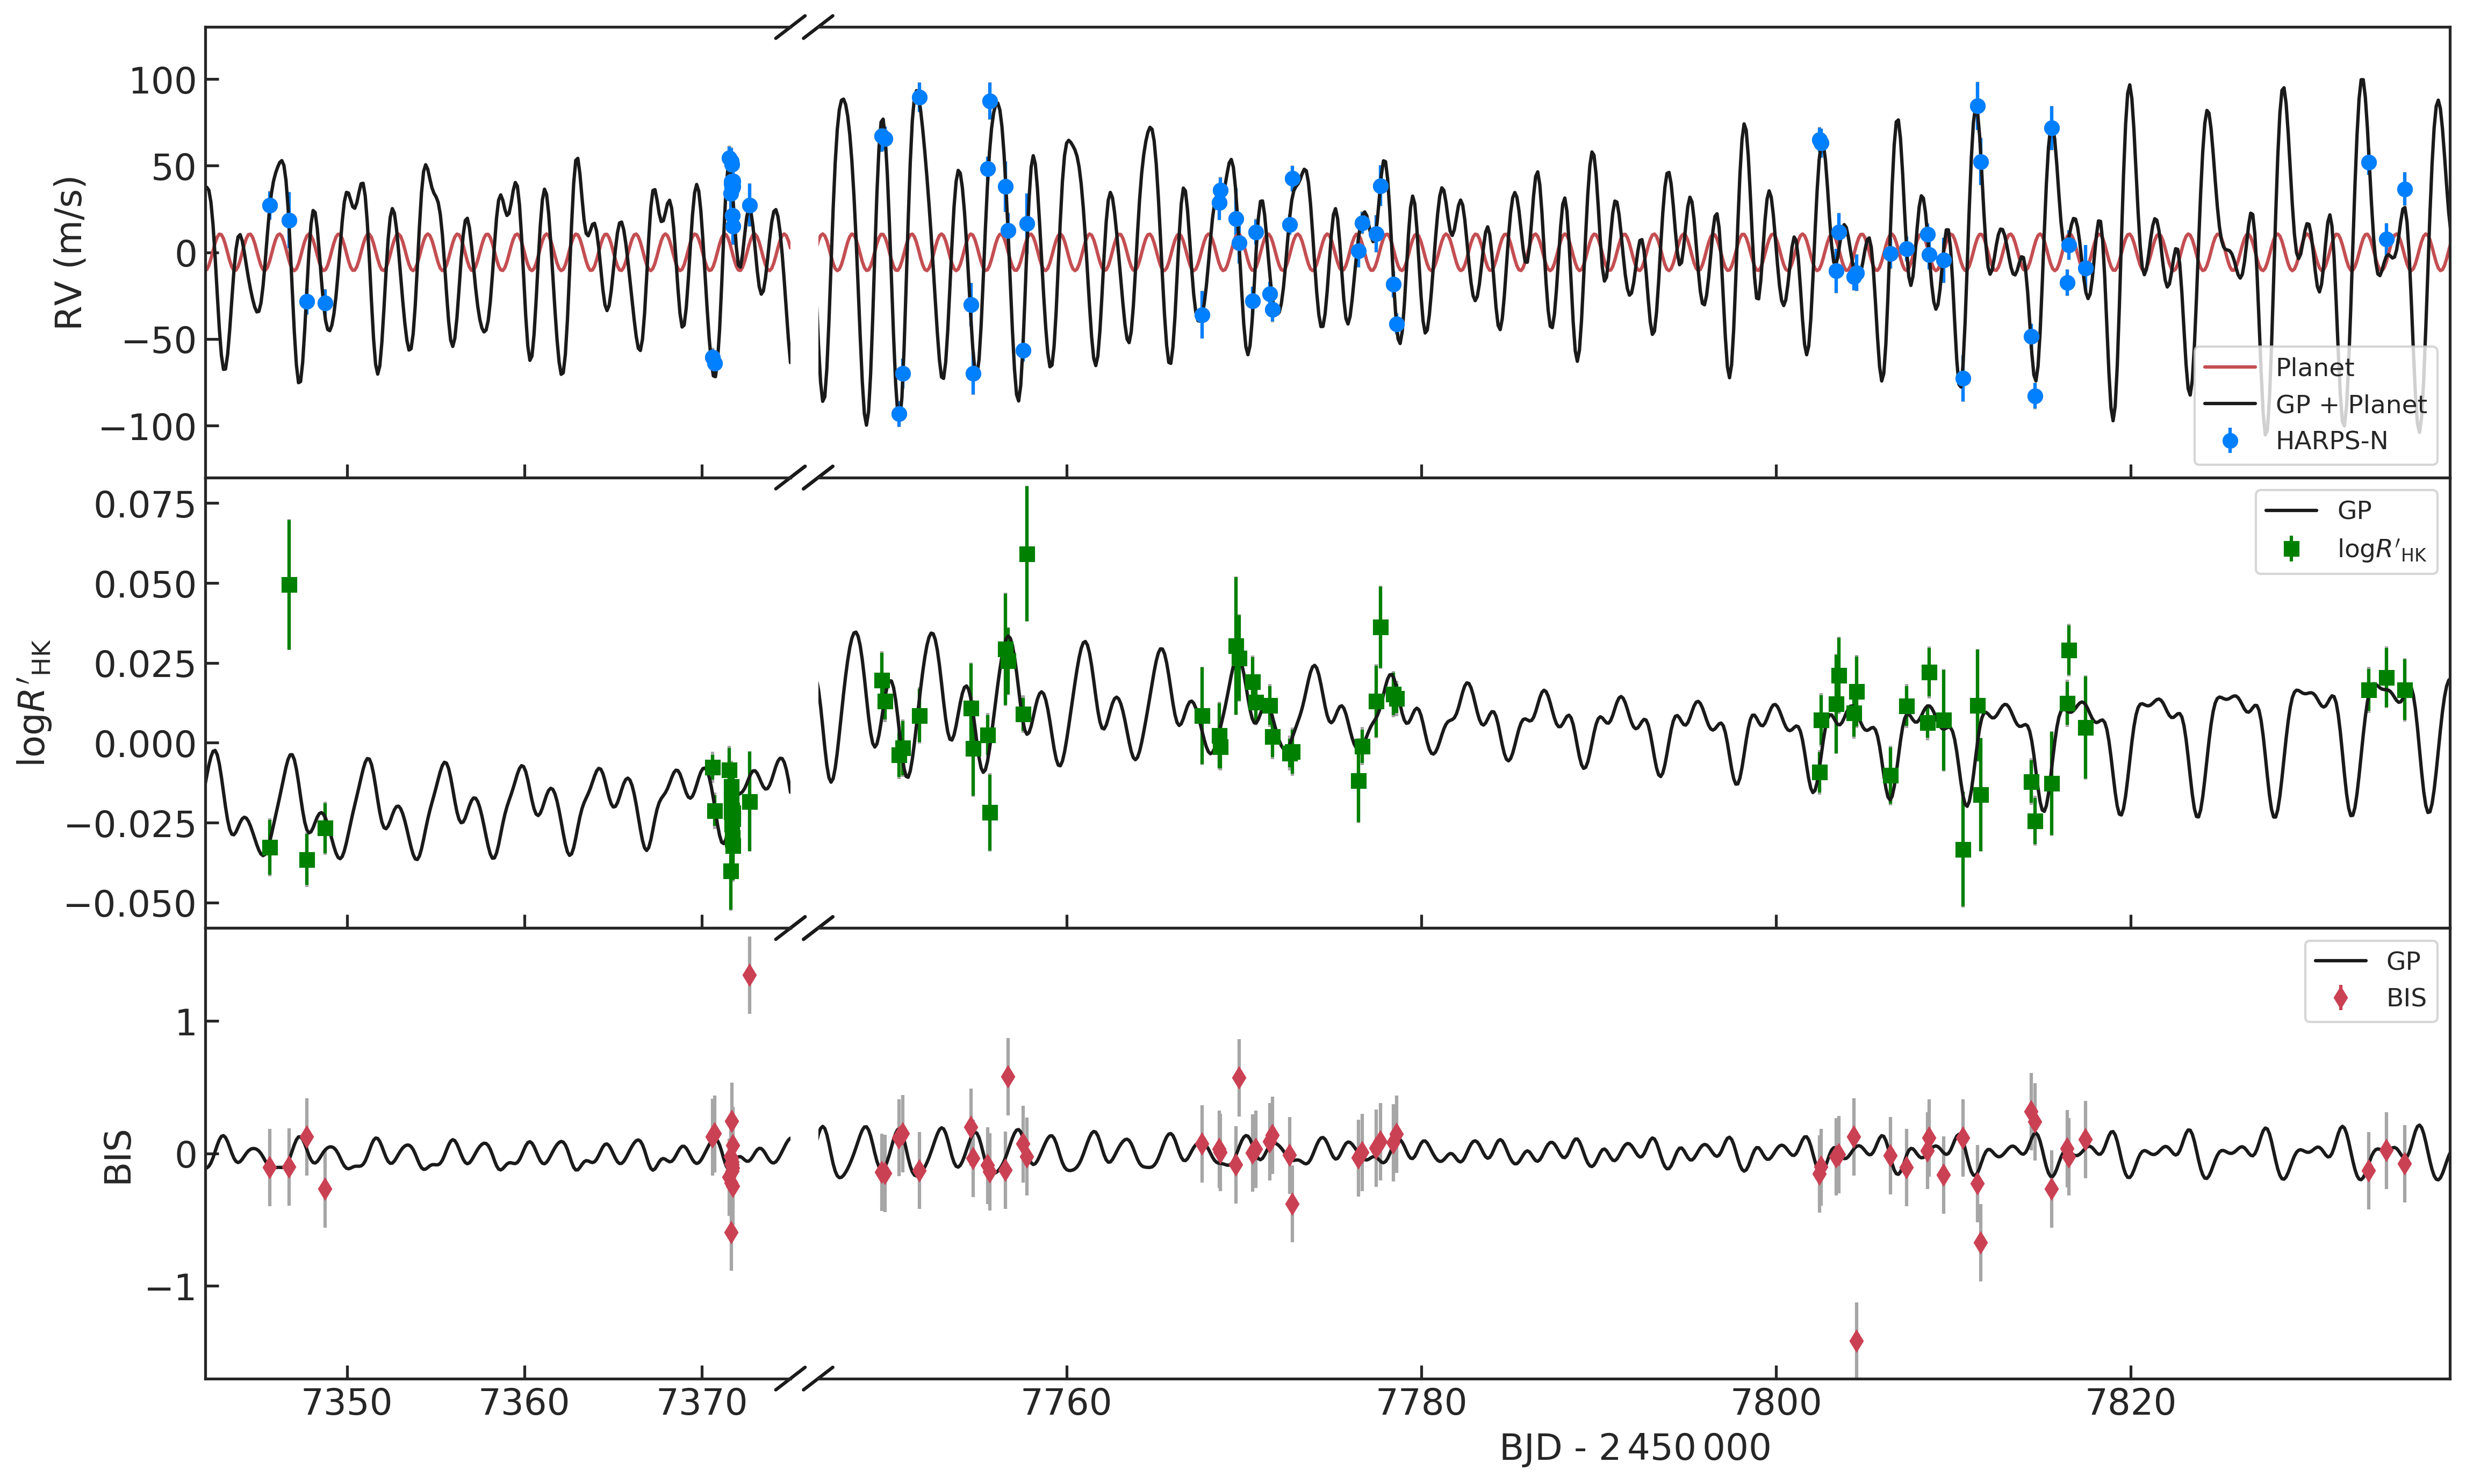
Figure 4: Radial velocity (top), log R? HK (middle) and BIS (bottom) time-series. All time-series have been corrected by the inferred offset. Inferred models are presented as solid continuous lines. Measurements are shown with filled symbols with error bars. Grey error bars account for the jitter. We note that there is a gap between 7375 and 7746 BJD - 2 450 000 where there were no measurements.
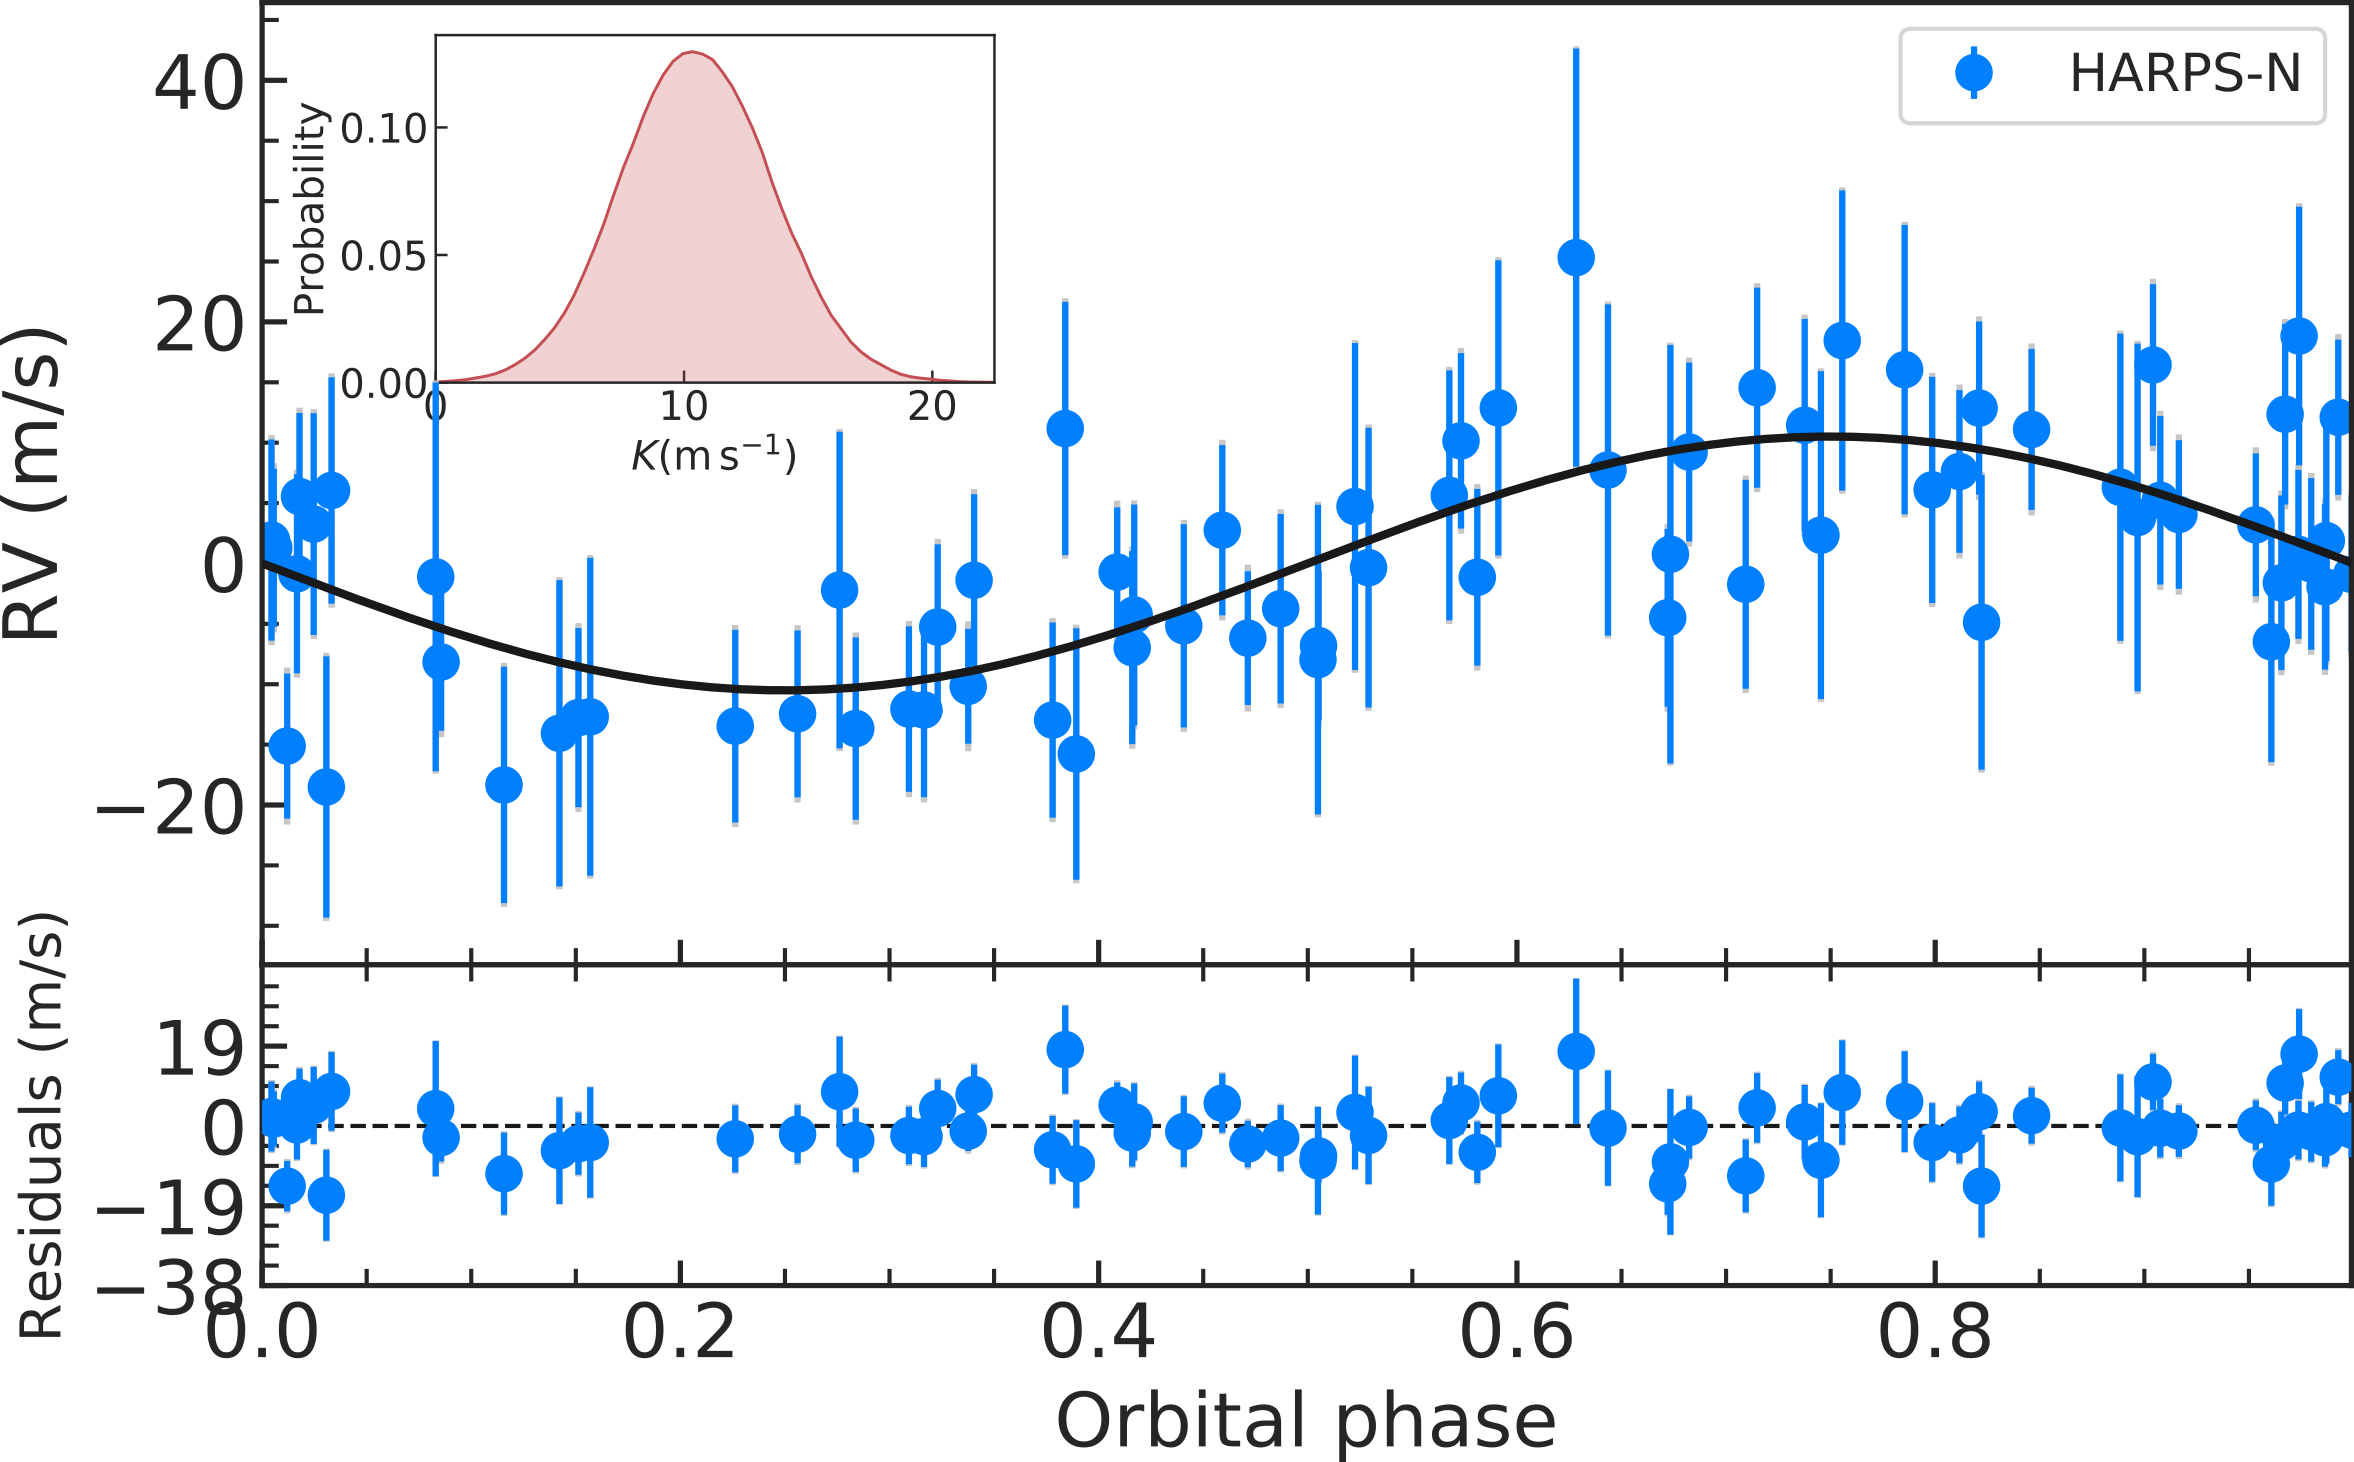
Figure 5: RV curve of K2-100 folded to the orbital period of K2-100b. HARPS-N data (blue circles) are shown following the subtraction of the instrumental offset and GP model. Grey error bars account for the jitter. The Keplerian solution is shown as a solid line. Top-left inset displays the posterior distribution for K.
Is K2-100b special?
Figure 6 shows a density vs insolation plot for small (< 4 R⊕) exoplanets. With a density of ~2 g/cm^3 and insolation of ~2000 F⊕, K2-100b occupies a unique position in this diagram.
Why is K2-100b puffier than other high irradiated planets? Well, this is because it is quite younger. Its atmosphere still has a long time to evolve.
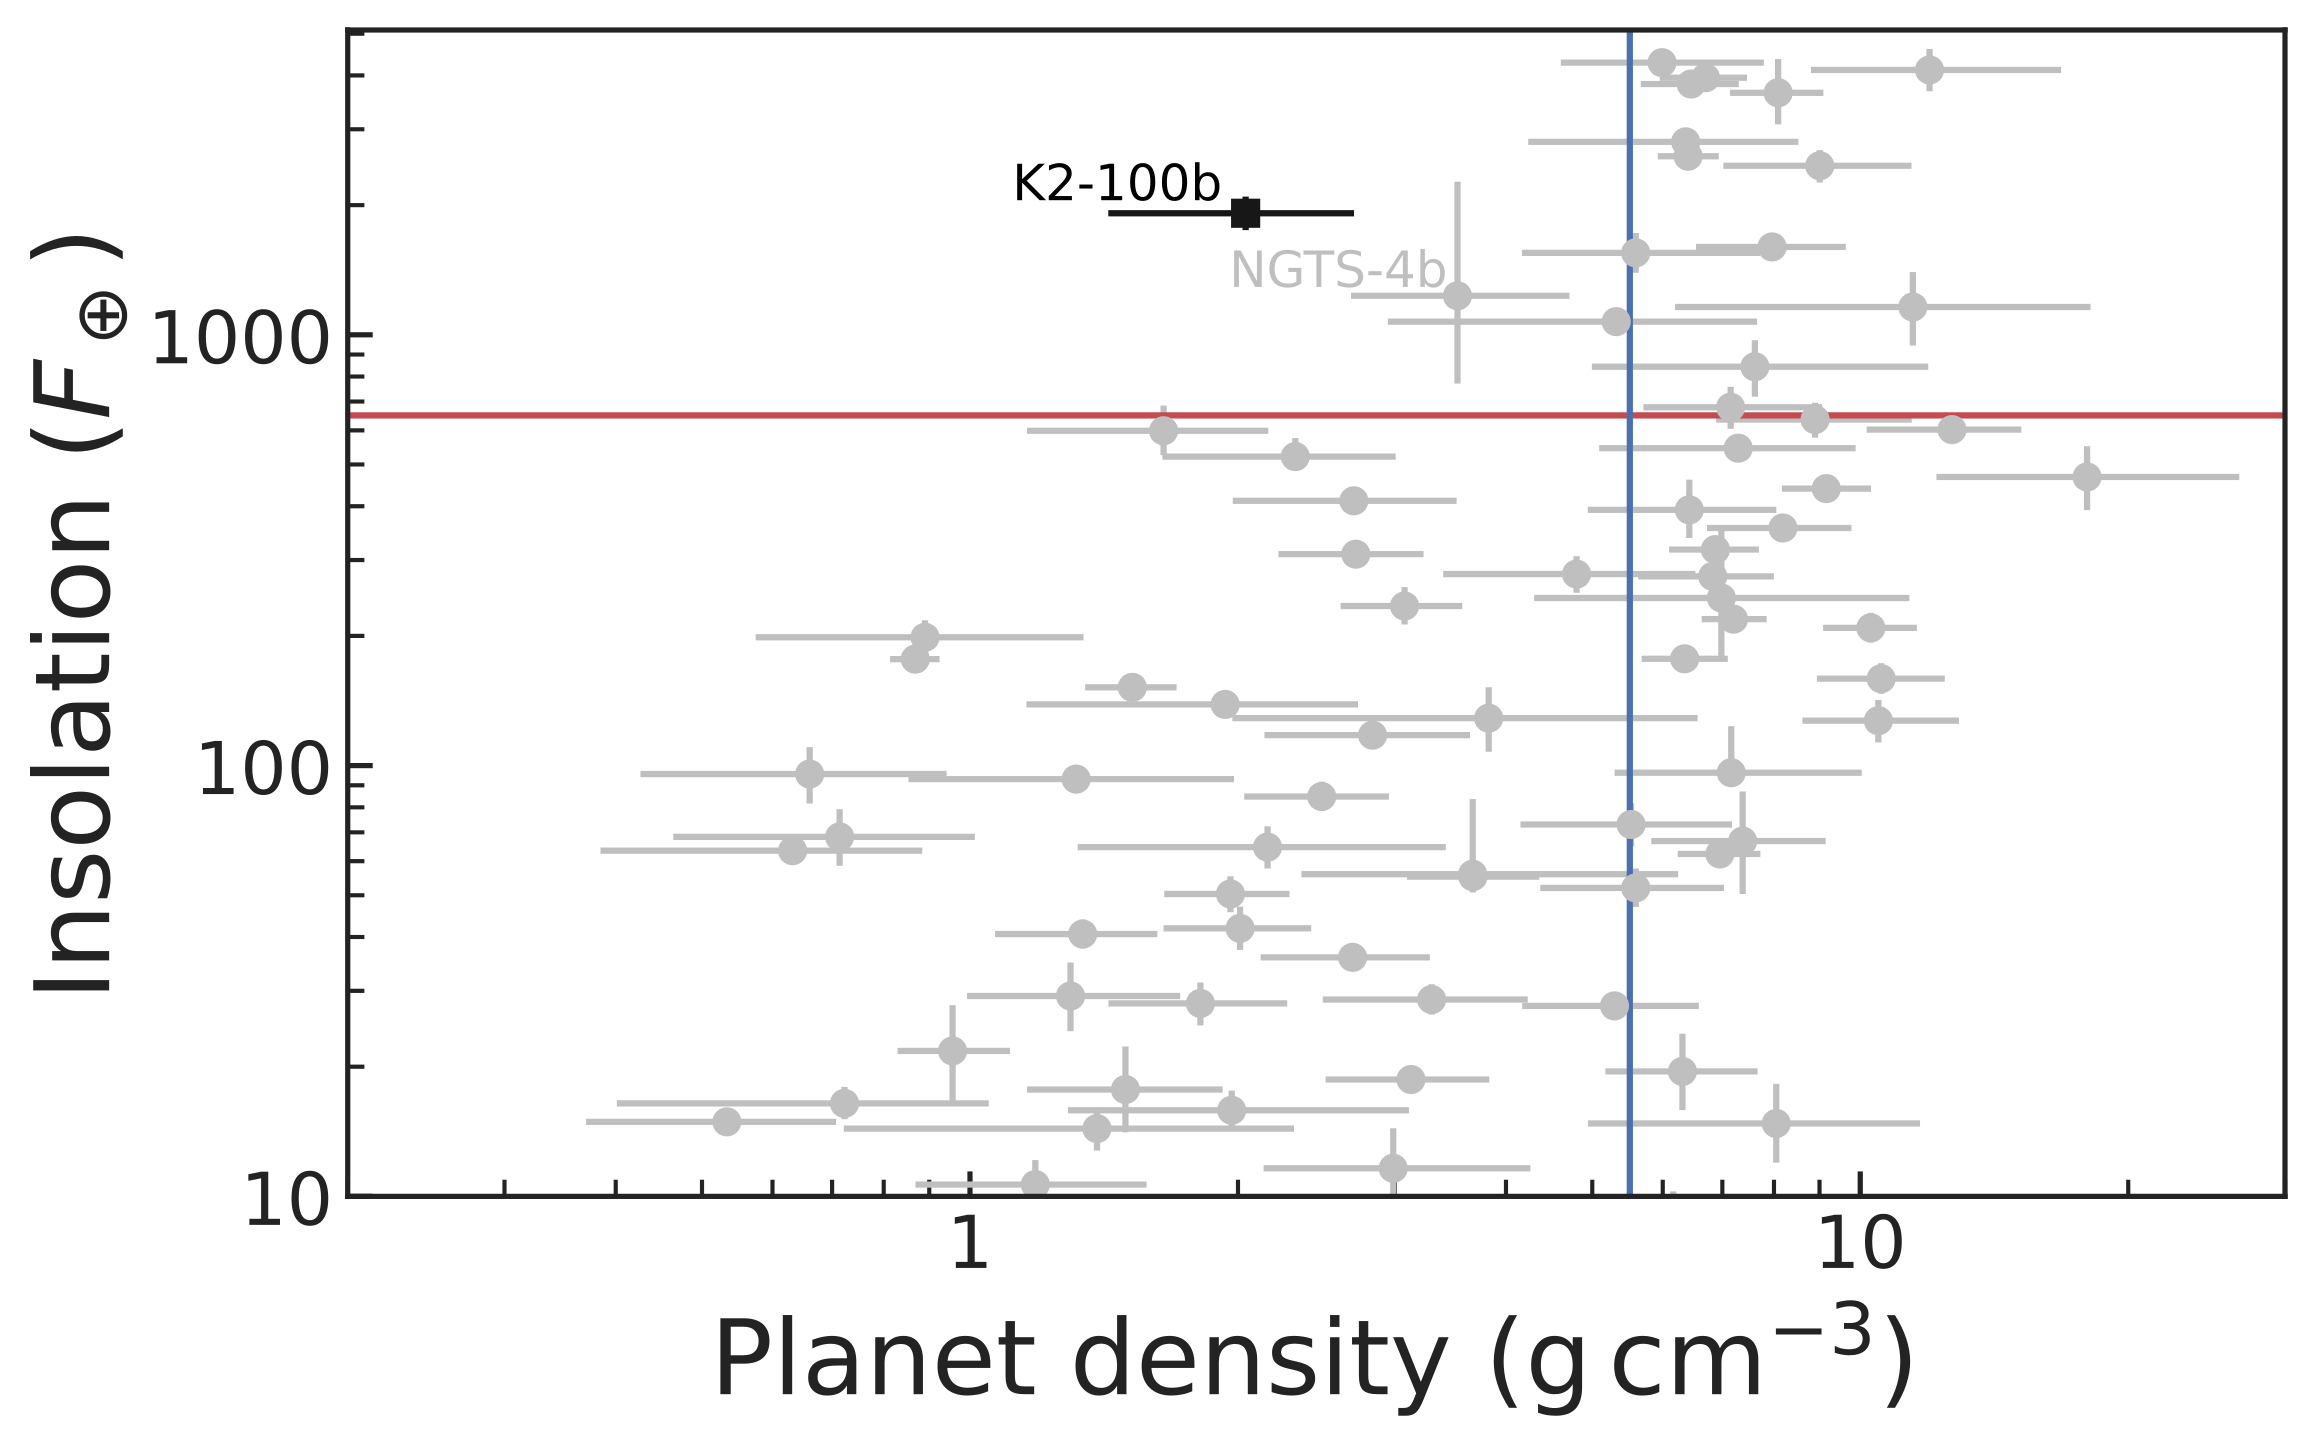
Figure 6: Planet density versus insolation for small (< 4 R⊕) transiting planets (gray circles). The location of K2-100b is marked with a black square. We also label NGTS-4b. Horizontal red line shows the insolation limit of 650 F⊕ given by Lundkvist et al. (2016). Vertical blue line corresponds to Earth’s density.
Figure 7 shows K2-100b in a mass-radius diagram together with other highly irradiated (> 650 F⊕) small (< 4 R⊕) exoplanets. K2-100b is consistent with a planet made of a solid core with a significant volatile envelope, while other high irradiated planets are consistent with a thinner or absent atmosphere.
With an insolation of ~2000 F_Earth, it was mandatory to model the future planetary atmospheric evolution, in particular, to estimate if (and when) the planet will lose its envelope. Our models indicate that K2-100b will lose atmosphere in the next Gyrs, with its final radius depending if the star evolves as slow (blue), moderate (green) and fast (red) rotator.
Figure 7: Mass vs radius diagram for small (Rp > 4 R⊕) planets which receive an insolation >650 larger than the Earth (gray circles). The location of K2-100b is marked with a black circle. Its predicted planetary mass and radius at 2 and 5 Gyr is shown with empty squares and diamonds, respectively, with colours corresponding to different initial rotation rates XUV fluxes for the star: fast/high (red), moderate (green) and slow/low (blue).
Conclusions
We showed how, by combining RV with activity indicators, we can disentangle planetary and activity RV variations for young active stars. These results encourage the RV follow-up of young or active stars to be discovered with missions such as The fantastic thing about K2-100b is that (no matter your favourite stellar evolution model) is currently evaporating! It is likely that with K2-100b we see the previous stage of all the older high irradiated planets. This makes K2-100 an excellent laboratory to test photoevaporation models.
References
Barragán O., Gandolfi D., Antoniciello G., 2019, MNRAS, 482, 1017 Kubyshkina D., et al., 2019, ApJ, 879, 26
Lundkvist M. S., et al., 2016, Nature Comm., 7, 11201
Mann A. W., et al., 2017, AJ, 153, 64
Rajpaul V., et al.,, 2015, MNRAS, 452, 2269
Click here to see all the papers mentioning K2-100b.